
Downtime tracking
Every stop recorded. Every reason named.
ThingConnect detects stops from the controller's own run state, polled every few seconds. An alert surfaces on the operator's screen, a few taps name the cause, and the loss Pareto updates live — so the improvement meeting starts from facts.
Machine-level detail timeline view Pareto reporting
Every machine, one shift, one screen.
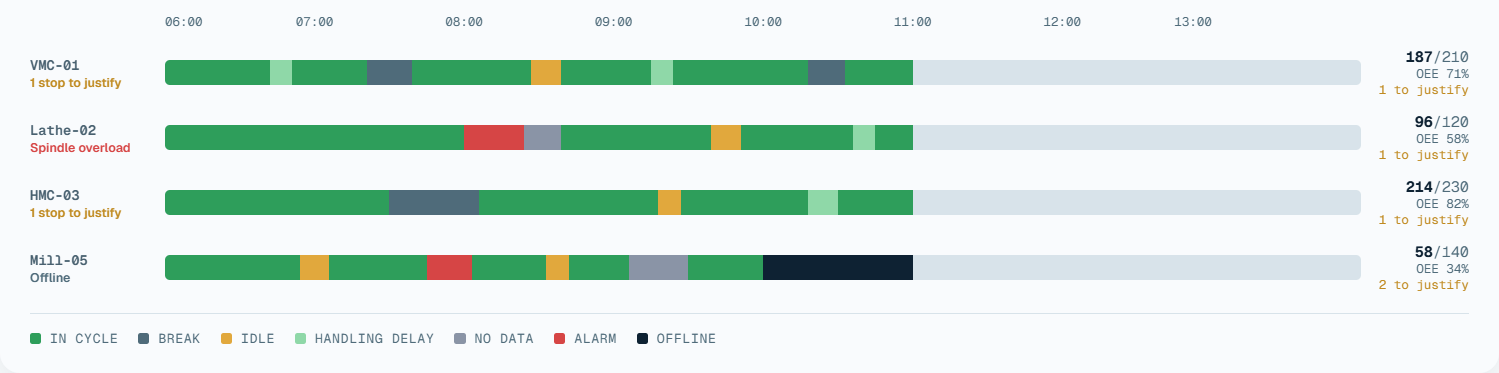 Tap to zoom
187/210
OEE 71%
1 to justify
96/120
OEE 58%
1 to justify
214/230
OEE 82%
1 to justify
58/140
OEE 34%
2 to justify
The problem
Where downtime hides today
- Stops under 10 minutes never make it to the logbook — and they are most of the loss.
- ‘Machine breakdown’ covers everything from a tool change to a blown spindle, so nothing is fixable.
- Downtime is compiled weekly, argued monthly, and improved never.
- The one person who knows why Line 2 stops every Tuesday retires next year.
How it works
One downtime, start to finish
Alerted, classified at the machine, backed by reasons your team configured, seen on the wall, and read back in the report — always the same number, never reconciled by hand.
The alert
A stop shows up as a floating card on the operator’s screen — start time, running duration, Dismiss or Classify. It never blocks what they’re already doing; it just stays in view until they act.
Started: 14:22
04:18
Honest status
Today this card is dismissible — it never blocks or dims the rest of the screen. A stricter mode that stays open until classified is a pattern we’ve considered, not built.
Classify at the machine
Tapping Classify opens category, then reason — a few taps, right where the stop happened, not reconstructed from memory at the end of the shift. A stop already explained by an alarm code can skip this step entirely.
Classify Downtime
Reasons, configured by your team
Categories and reasons are yours to edit, each one declaring what it does to OEE. Map a controller alarm code to a reason and a stop the machine already explained arrives pre-classified — planned stops included, not just breakdowns.
Categories
Reasons in Setup
No alarm codes mapped
🔔 2 alarm codes mapped
Alarm rules — Tool offset calibration. A stop that raises one of these codes classifies itself as Tool offset calibration — a planned stop, not unplanned — so the operator doesn’t have to remember to mark it Planned every time.
No alarm codes mapped
See the whole floor on the timeline wall
Every machine, one shift, one screen — running, changing over, or down, color-coded the same way across the wall so a supervisor reads the floor’s state at a glance, not machine by machine.
Read it back as a report
Every classified stop rolls up into a ranked loss report, longest bar first — planned, unplanned, and whatever’s still unclassified stays visible until someone names it.
By reason
this weekOn the floor
Three real screens, one shift
The op-screen entry, the timeline wall, and one machine’s own detail panel — all reading the same events, at three different distances from the machine.
The operator’s tablet
A stop doesn’t wait for anyone to notice it — a floating card appears over whatever’s already open on screen, viewable with no login. Tap Classify for the same flow as Step 2 above, or dismiss it and come back later.
Reactive alert · stage 1
- Floats over whatever's already open
- Viewable with no login
- Never blocks — dismiss it, or act on it later
Every machine, color-coded
In cycle, on break, idle, in a handling delay, missing data, alarmed, or offline — the same seven states as the tile at the top of this page, so a supervisor reads the floor at a glance.
Every tile refreshes about every 10 seconds — not a live push, but fast enough that a supervisor walking the floor always knows what’s actually stuck.
↑ See the full timeline wall aboveOpen one machine and see why
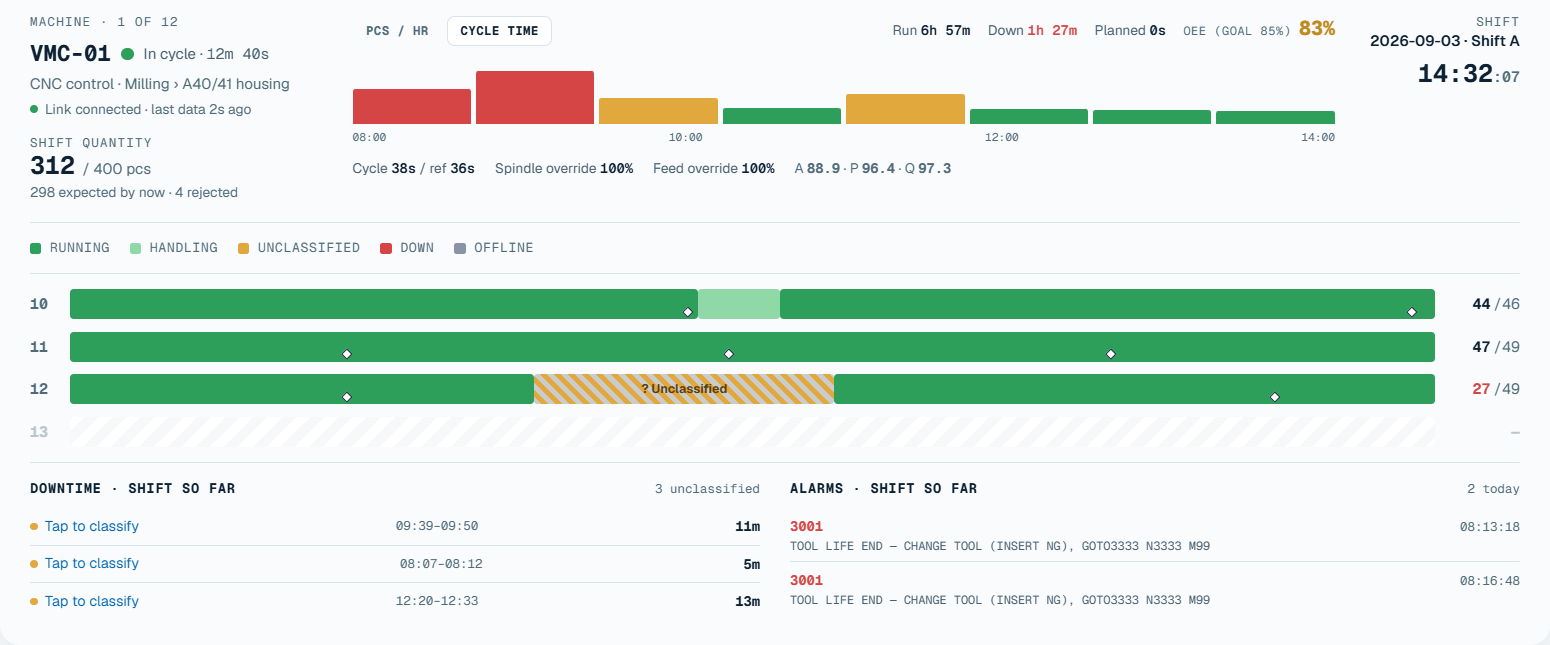
Quantity, current part, OEE trend, and the shift’s hour-by-hour rhythm lanes — with any stretch still unclassified sitting right there, one tap from a reason, not buried in a separate report.
 Tap to zoom
Machine · 1 of 12
CNC control · Milling › A40/41 housing
Link connected · last data 2s ago
Shift quantity
298 expected by now · 4 rejected
Shift
2026-09-03 · Shift A
14:32:07
Downtime · shift so far
3 unclassified- Tap to classify09:39–09:5011m
- Tap to classify08:07–08:125m
- Tap to classify12:20–12:3313m
Alarms · shift so far
2 today- 300108:13:18
TOOL LIFE END — CHANGE TOOL (INSERT NG), GOTO3333 N3333 M99
- 300108:16:48
TOOL LIFE END — CHANGE TOOL (INSERT NG), GOTO3333 N3333 M99
The numbers
Every stop, counted and logged
The same classified events behind the Pareto above, rolled into a KPI strip and itemized underneath — nothing summarized away.
Downtime
9.2h
14 idle events across 5 machines
Idle
14
longest idle 42m
Unclassified
12%
2 idle events nobody justified
Downtime logs
| When | Machine | Duration | Reason | Response |
|---|---|---|---|---|
| 14:32 | VMC-01 | 18m | Tool change | resp 2m |
| 13:05 | Lathe-02 | 6m | Break | resp 1m |
| 11:40 | HMC-03 | 22m | Unclassified | resp — |
| 10:15 | VMC-02 | 9m | Changeover / setup | resp 3m |
| 09:02 | Lathe-03 | 14m | Fixture change | resp 5m |
Questions
Before you book a demo
From the controller’s run state, polled every few seconds — not from current sensors or operator entry. A code the control reports can auto-classify the stop on its own, before anyone taps a thing.
It shows up as ‘Unclassified’ — on the machine’s own tile, in the report’s KPI strip, and in the log. Unnamed downtime stays visible until someone names it, which is how classification discipline actually builds.
Yes. Two-level reason trees (category → reason) are fully editable by your admin, and we seed them with CNC-appropriate defaults during deployment so day one works.
Yes — planned maintenance, changeovers, and breaks are classified separately from unplanned stops, per your plant’s OEE rules.
Get started
See it on machines like yours
A 30-minute demo, then a pilot on your own floor if it fits.