
Machine utilization
Is your utilization really 70%?
Most plants believe a utilization number that came from an assumption. ThingConnect measures it from the controller — when each machine actually ran, for how long, on what — so capacity and capex decisions rest on facts.
In-cycle vs. scheduled vs. idle machine × hour heatmap worst-first ranking
One shift, every machine, hour by hour — a ranked table can't show a pattern like a schedule dip; a heatmap can.
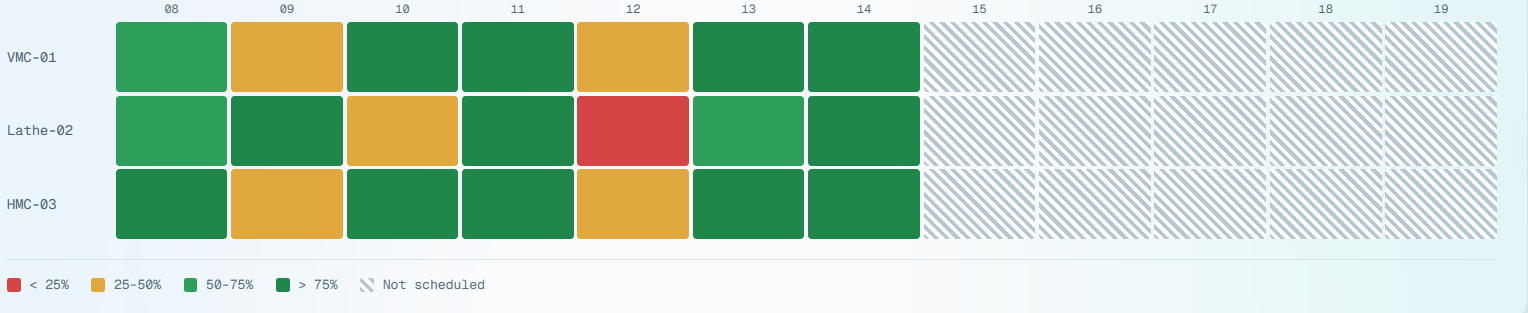 Tap to zoom
- < 25%
- 25–50%
- 50–75%
- > 75%
- Not scheduled
The problem
Decisions being made on assumed numbers
- A new machine gets approved while three existing ones sit idle 30% of the day — invisibly.
- Quotes assume capacity that the floor doesn't actually have.
- 'We're running flat out' and 'the machines are half idle' are both said in the same meeting.
- Second-shift viability is debated on gut feel because nobody trusts the utilization sheet.
How it works
Measured from the control, not assumed
Measured, not assumed
Utilization is computed from controller run state against calendar or shift time — your choice of denominator, stated on every report.
Per machine, per cell, per week
Rank machines by utilization, spot the chronically idle ones, and see patterns by shift and day of week.
The capex conversation, settled
When someone proposes buying capacity, the utilization report shows whether you already own it. This report pays for the system.
What the report shows
From one calendar split to an hourly trend
The same real breakdown of calendar time — not scheduled, idle, in-cycle — read one way as four numbers, and another way as a hour-by-hour line against a goal.
Every hour is one of three things
Not scheduled, idle, or in-cycle — a strict breakdown of calendar time, not four independent numbers someone has to reconcile by hand. Idle isn’t a separate query either: it’s scheduled hours minus in-cycle time, the same idle concept the downtime report already classifies in full.
In-cycle
65.9%
of 21h scheduled machine-hours
Scheduled
21h
of 36h in the production window
Not scheduled
15h
the TEEP gap — vs. the whole shift plan
Idle
7.2h
scheduled, but not cutting
In-cycle %, hour by hour, against a goal
The fleet average from the heatmap above, replotted as a trend against a goal line — the only comparison this report supports, because there’s no industry benchmark worth trusting, only your own plan.
↑ See the full machine × hour heatmap aboveIn-cycle %, one point per hour, this shift.
- In-cycle % · fleet average
- 80% goal
Per machine
Worst in-cycle % first
The same ranking discipline as every other report on this site — not sortable by column, so a ranking exists to be acted on, not silently re-ordered.
Machine, in-cycle %, idle, stops, good parts — no 'Control' column, since no controller/model field exists anywhere in this app.
| Machine | In-cycle % | Idle | Stops | Good parts |
|---|---|---|---|---|
| Lathe-02 | 61.3% | 2.7h | 8 | 410 |
| VMC-01 | 66.4% | 2.3h | 5 | 560 |
| HMC-03 | 70% | 2.1h | 3 | 640 |
Questions
Before you book a demo
Utilization asks 'was the machine running?' against total available time; OEE also weighs speed and quality while running. ThingConnect reports both, clearly labeled, because mixing them up is the most common measurement mistake we see.
Your choice, and both can be shown. Calendar-time utilization (TEEP-style) exposes unused capacity; shift-time utilization measures how well staffed time is used.
Yes — per machine, group, line, or plant, across any date range, exportable to Excel.
As accurate as the control's own state reporting, which is what the machine itself believes. Machines without a connectable control are flagged in the site survey rather than guessed at.
Get started
See your real utilization number
A 30-minute demo, then a pilot on your own floor if it fits.